Drawing robust support and resistance (S&R) levels is arguably the most fundamental skill in technical analysis, a cornerstone that separates aspiring traders from consistently profitable ones. In 2026, with markets moving faster and algorithms dominating short-term price action, understanding these zones as a reflection of collective market psychology is more crucial than ever. It's not just about drawing lines on a chart; it's about anticipating where supply and demand imbalances are likely to occur, providing high-probability entry and exit points. A truly professional approach to S&R involves a blend of historical price action, multiple timeframes, and an acute awareness of market sentiment. Without this foundational understanding, even the most sophisticated indicators and AI-driven systems will fall short of their potential.
The Pillars of Price Action: Understanding Support and Resistance
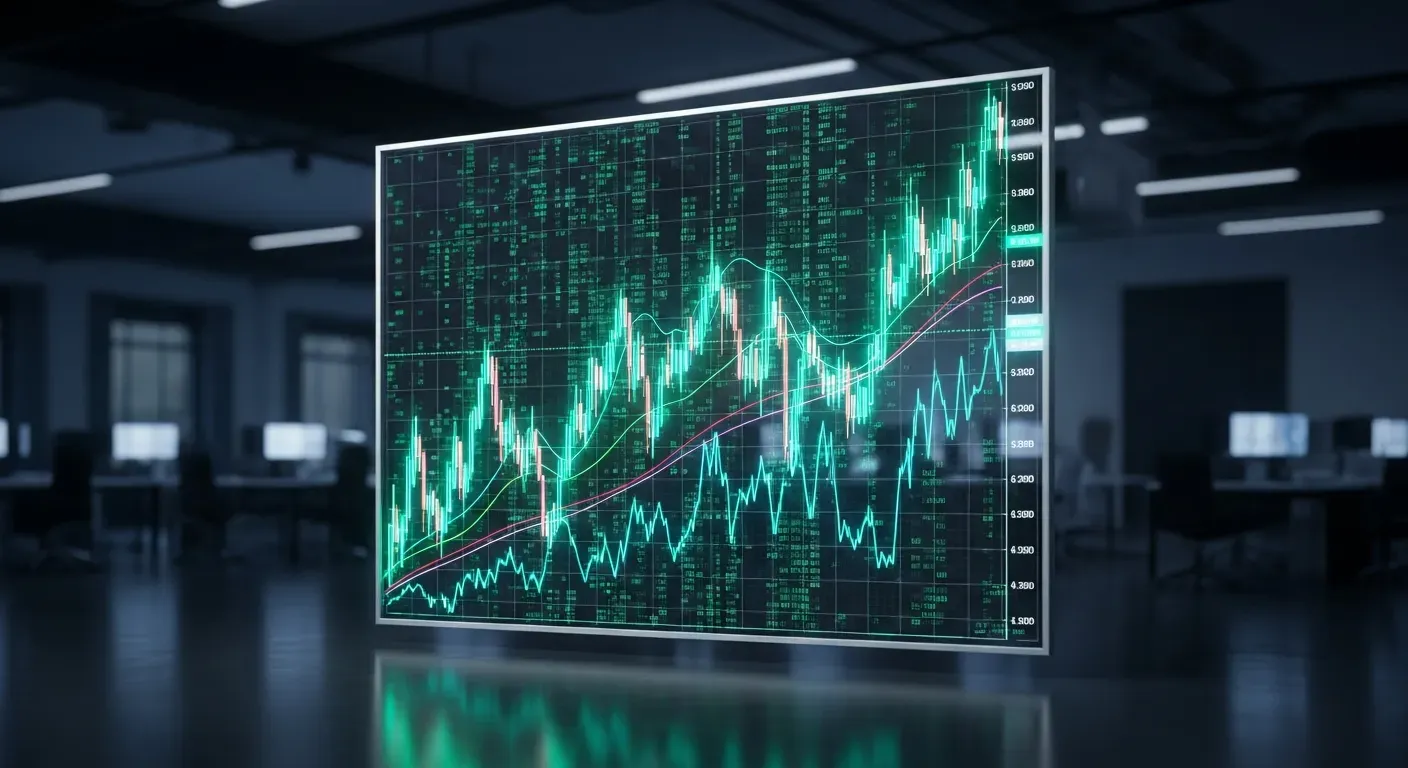
At its core, support is a price level where buying interest is strong enough to prevent the price from falling further, while resistance is a price level where selling interest is strong enough to prevent the price from rising higher. Think of it as a battleground between buyers and sellers. When prices approach support, buyers tend to step in, seeing value. When prices approach resistance, sellers emerge, taking profits or initiating short positions.
These levels are fundamentally psychological. Traders remember past turning points. A previous high that held multiple times becomes a mental barrier for future price advances. Similarly, a previous low that saw strong buying becomes a floor. The more times a level has been tested and held, the stronger it is perceived to be. This collective memory, often amplified by the "digital herd" mentality as discussed in The Digital Herd: How Emotional Contagion on Social Media Drives Market Cycles in 2026, underpins the efficacy of S&R.
Support and resistance can be categorized into two main types:
- Static S&R: These are fixed price levels that do not change over time. Horizontal lines derived from historical swing highs and lows, Fibonacci retracement levels, and pivot points are examples of static S&R. They represent specific price points where major turning points occurred in the past.
- Dynamic S&R: These levels change with price over time. Moving averages, trendlines, and channels are prime examples. A 50-period moving average acts as dynamic support during an uptrend, constantly adjusting as new price data comes in.
⚡ Featured Brokers


Identifying Key Levels: Beyond the Obvious
Drawing S&R effectively requires precision, patience, and a nuanced understanding of market behavior. It's rarely about a single perfect line, but rather about identifying zones of interest.
1. Horizontal Support and Resistance: The Bedrock
The most common form of S&R comes from significant historical swing highs and lows.
- Swing Highs/Lows: Identify points where the market sharply reversed direction. These are the clearest indicators of past supply and demand imbalances.
- The "Touch" Principle: A support or resistance level gains strength with each successful test. If a level has held as resistance multiple times, the probability of it holding again increases. However, remember that every test also weakens the level slightly, like water eroding a rock. Eventually, it may break.
- The "Flip" Principle (Polarity Change): This is a critical concept. Once a strong resistance level is decisively broken, it often acts as future support. Conversely, a broken support level can become new resistance. This phenomenon offers excellent trading opportunities for pullback entries.
Let's consider an example for clarity:
| Characteristic | Strong S/R Zone | Weak S/R Zone |
|---|---|---|
| Number of Touches | Multiple (3+), clear bounces/rejections | Few (1-2), vague reversals |
| Timeframe | Visible on higher timeframes (Daily, Weekly) | Primarily on lower timeframes (M15, H1) |
| Volume/Momentum | Significant volume/momentum reversal at level | Low volume, hesitant reversals |
| Candle Structure | Strong reversal candles (pin bars, engulfing) | Weak, indecisive candles |
| Duration Held | Held for weeks or months | Holds for hours or a few days |
| "Flip" Potential | High probability of polarity change | Low or inconsistent polarity change |
2. Trendlines and Channels: Dynamic Pathways
Trendlines are diagonal lines that connect a series of higher lows in an uptrend (support) or lower highs in a downtrend (resistance). They represent the general direction and slope of the market.
- Drawing Valid Trendlines: You need at least two significant price points to draw a trendline, but three or more make it more reliable. For an uptrend, connect the lowest possible points without cutting through major price action. For a downtrend, connect the highest possible points.
- Channels: When you can draw a parallel line to your trendline on the opposite side of the price action, you have a channel. Channels define a trading range within a trend, offering potential entry and exit points at their boundaries. A break of a channel often signals an acceleration or reversal of the trend.
3. Moving Averages: Fluid Support and Resistance
Moving averages are dynamic S&R levels that smooth out price data, providing a clearer view of the trend. Common choices include the 50, 100, and 200-period Simple Moving Averages (SMAs) or Exponential Moving Averages (EMAs).
- During an uptrend, price often finds support at a moving average.
- During a downtrend, price often finds resistance at a moving average.
- Cross-overs of moving averages (e.g., 50-SMA crossing above 200-SMA) are often used as trend reversal or continuation signals.
4. Fibonacci Retracement: Harmonic Levels
Fibonacci retracement levels (38.2%, 50%, 61.8%, 78.6%) are derived from a mathematical sequence and are widely followed by traders. When a market pulls back after a significant move, these levels often act as natural support or resistance.
- Draw the Fibonacci tool from the low to the high of an impulse move (for a pullback in an uptrend) or from high to low (for a pullback in a downtrend).
- The most significant retracement level is often the 61.8%, followed by the 50%.
- Confluence: Fibonacci levels are most powerful when they coincide with other S&R levels (e.g., a 61.8% Fib level lining up with a historical horizontal support zone).
5. Pivot Points: Daily, Weekly, Monthly
Pivot points are calculated based on the previous period's high, low, and closing prices. They provide predictive S&R levels for the current period.
- Traditional Pivot Points: The main pivot point (P) acts as a central axis, with various support (S1, S2, S3) and resistance (R1, R2, R3) levels radiating from it.
- Application: Traders often look for price to reverse at these levels, or for a break of P to indicate a shift in sentiment. These are particularly popular among day traders. Many brokers, including our partner FP Markets, offer pivot point indicators directly on their platforms like MetaTrader.
The Pro's Edge: Refining Your S&R Drawing
Simply identifying these levels isn't enough. A professional trader integrates S&R into a broader strategic framework.
Zones, Not Lines
This is critical. Support and resistance are rarely exact price points; they are areas where supply and demand dynamics shift. Price often penetrates a "line" slightly before reversing. By thinking in terms of zones (e.g., a 10-pip or 20-pip range around a significant level), you can avoid being whipsawed by minor breaches and improve your entry and exit precision.
Multiple Timeframe Analysis
Never draw S&R on just one timeframe. A robust S&R level on the daily chart carries far more weight than one on a 15-minute chart.
- Start with higher timeframes (Weekly, Daily) to identify major, long-term S&R zones.
- Then, drill down to intermediate timeframes (H4, H1) to refine these zones and identify more immediate levels within the broader context.
- Finally, use lower timeframes (M15, M5) for precise entries and exits, always respecting the overarching S&R from higher timeframes. Ignoring higher timeframe S&R is a common mistake that can lead to being caught on the wrong side of a major move.
Market Structure and Context
S&R levels are best understood within the context of overall market structure. Is the market trending, ranging, or reversing?
- In a strong uptrend, previous resistance levels that are broken become more significant as potential future support.
- In a ranging market, price will likely oscillate between well-defined support and resistance levels.
- Understanding market phases helps you anticipate how S&R levels might behave.
False Breakouts and Traps
Amateur traders often jump into a trade the moment a support or resistance line is "broken." Professional traders understand that false breakouts are common, designed to trap impatient traders.
- Confirmation: Always wait for confirmation of a breakout. This might involve a candle closing decisively above/below the level, a retest of the broken level, or a surge in volume.
- The "Wick Test": Sometimes, price will wick through a level but close back above/below it. This can be a sign of a failed breakout attempt, providing an opportunity to fade the move. These "fakes" are often driven by algorithms looking to trigger stop-losses, especially around significant round numbers. For more on the psychological traps, see The Digital Herd: How Emotional Contagion on Social Media Drives Market Cycles in 2026.
The Role of Volatility
High volatility means wider price swings, which implies that your S&R zones might need to be wider. Low volatility might allow for tighter zones. Tools like Average True Range (ATR) can help you gauge the current market volatility and adjust your zone width accordingly. SVX Strategies dedicates significant research to volatility modeling, understanding how it impacts the probabilistic outcome of S&R interactions, especially in automated systems.
Automation and AI in S&R Identification
In 2026, manual drawing of S&R is still fundamental for understanding, but AI and advanced algorithms are revolutionizing its application. Machine learning models can analyze vast datasets to identify not just traditional S&R, but also more subtle, complex patterns that signify supply/demand shifts.
- Predictive Analytics: AI can predict the strength and likelihood of a level holding based on historical data, volume profiles, and correlation with other assets.
- Algorithmic Trading: Many advanced algorithms use dynamically calculated S&R levels to place limit orders, manage stops, and execute high-frequency trades. For retail traders, platforms are increasingly offering smart indicators that highlight significant S&R zones automatically. Understanding these underlying principles is crucial even when using automated tools. Check out The AI Revolution in Forex: Automated Trading and Advanced Analytics Reshape 2026 for a deeper dive.
Trading Strategies with S&R
Once you've mastered drawing S&R, you can develop robust trading strategies:
- Reversal Trading: Look for clear reversals (e.g., strong bearish engulfing candle at resistance, pin bar at support). These are typically high-probability trades but require confirmation.
- Breakout Trading: Wait for a decisive break of a major S&R level, often followed by a retest. This indicates a shift in market sentiment. Be patient and confirm the breakout to avoid false signals.
- Range Trading: In choppy or consolidating markets, trade bounces off support and rejections off resistance. This requires discipline and clear boundaries.
- Risk Management: S&R levels are natural places for setting stop-loss and take-profit orders. Placing your stop just beyond a strong S&R zone (for reversal trades) or at the retest level (for breakout trades) makes logical sense. For more on managing risk with leverage, see Leverage: How to Use It Without Blowing Your Account. Many top brokers like Fusion Markets and IC Markets offer platforms and tools that facilitate precise stop-loss and take-profit order placement.
Common Mistakes and How to Avoid Them
Even experienced traders make mistakes with S&R.
- Over-Drawing: Don't clutter your chart with too many lines. Focus on the most significant, high-probability levels. Less is often more.
- Ignoring Higher Timeframes: As mentioned, neglecting the bigger picture from higher timeframes is a recipe for disaster.
- Not Adapting: Market conditions change. A strong support level in a bullish market might not hold in a bearish one. Be flexible and reassess your S&R levels regularly.
- Trading Every Touch: Not every touch of S&R is a trading opportunity. Wait for clear price action confirmation, like specific candle patterns or momentum shifts.
The skill of drawing support and resistance levels like a pro is honed through practice, observation, and continuous learning. It's a foundational element of sound trading strategy and forms the basis for understanding market structure and anticipating future price movements. Combine this skill with reliable execution from a broker like Pepperstone , and you'll be well on your way to navigating the complex markets of 2026 with confidence.
Frequently Asked Questions
What is the difference between static and dynamic support and resistance?
Static S&R refers to fixed price levels that do not change, such as historical swing highs/lows, Fibonacci levels, or pivot points. Dynamic S&R levels adjust with price over time, like moving averages or trendlines, providing fluid areas of potential supply and demand.
How many touches make a support or resistance level strong?
Generally, a level that has been tested and held successfully three or more times is considered stronger and more significant. However, each subsequent test can also slightly weaken the level. Look for clear rejections or bounces at these points.
Why is it important to use multiple timeframes when drawing S&R?
Analyzing S&R across multiple timeframes provides context and confirmation. Higher timeframe S&R levels (e.g., Daily, Weekly) are more significant and act as major barriers, while lower timeframe S&R (e.g., H1, M15) can be used for precise entry and exit points within the broader market structure defined by the higher timeframes.
Should I draw S&R as lines or zones?
It is highly recommended to view support and resistance as "zones" rather than thin, exact lines. Price rarely reverses at an exact point; it often penetrates a level slightly before reversing. Drawing zones accounts for market noise and gives you a more realistic perspective for setting stop losses and take profits.
Can AI and algorithms help with identifying support and resistance?
Yes, in 2026, AI and machine learning algorithms are increasingly sophisticated at identifying S&R levels, sometimes even predicting their strength and likely reactions. These automated tools can process vast amounts of data more quickly than humans, providing additional layers of analysis, though fundamental understanding remains key for effective strategy application.
What are "false breakouts" and how can I avoid them?
False breakouts occur when the price briefly moves beyond a support or resistance level only to reverse quickly back into its original range, often trapping traders who entered prematurely. To avoid them, wait for confirmation, such as a strong candle close above/below the level, a retest of the broken level, or increased volume in the direction of the breakout.
How does volatility affect support and resistance levels?
Higher volatility often means wider price swings, which suggests that your support and resistance zones might need to be wider to accommodate the increased price movement. In contrast, lower volatility might allow for tighter S&R zones. Adjusting your S&R based on prevailing volatility helps in setting more effective stop losses and take profits.
Disclaimer: Content for educational purposes only. Not financial advice. Trading carries high risk. Past performance of SVX or any system does not guarantee future results.
📡 FBC Ecosystem:
This analysis is just one piece of the puzzle.
- For tactical execution: Follow X (Twitter)
- For the morning briefing: Join Telegram

.webp)